Ilma1 is a Navtex decoder for the Raspberry Pi that just got weather fax (WEFAX) capabilities. For an offshore sailor, reliable weather forecasts are essential. Ilma continuously receives and decodes Navtex, as recently described. The addition of weather fax extends Ilma’s features to charts showing barometric pressure, sea temperature, wave direction, or ice.
Adding weather fax capabilities to Ilma was a quest for straight lines in the decoded charts. Ilma’s first decode came back warped with a strange S-shape (Figure 1).2 An S-shape was not what I expected – the usual problem is skewing. I would get plenty of that later.
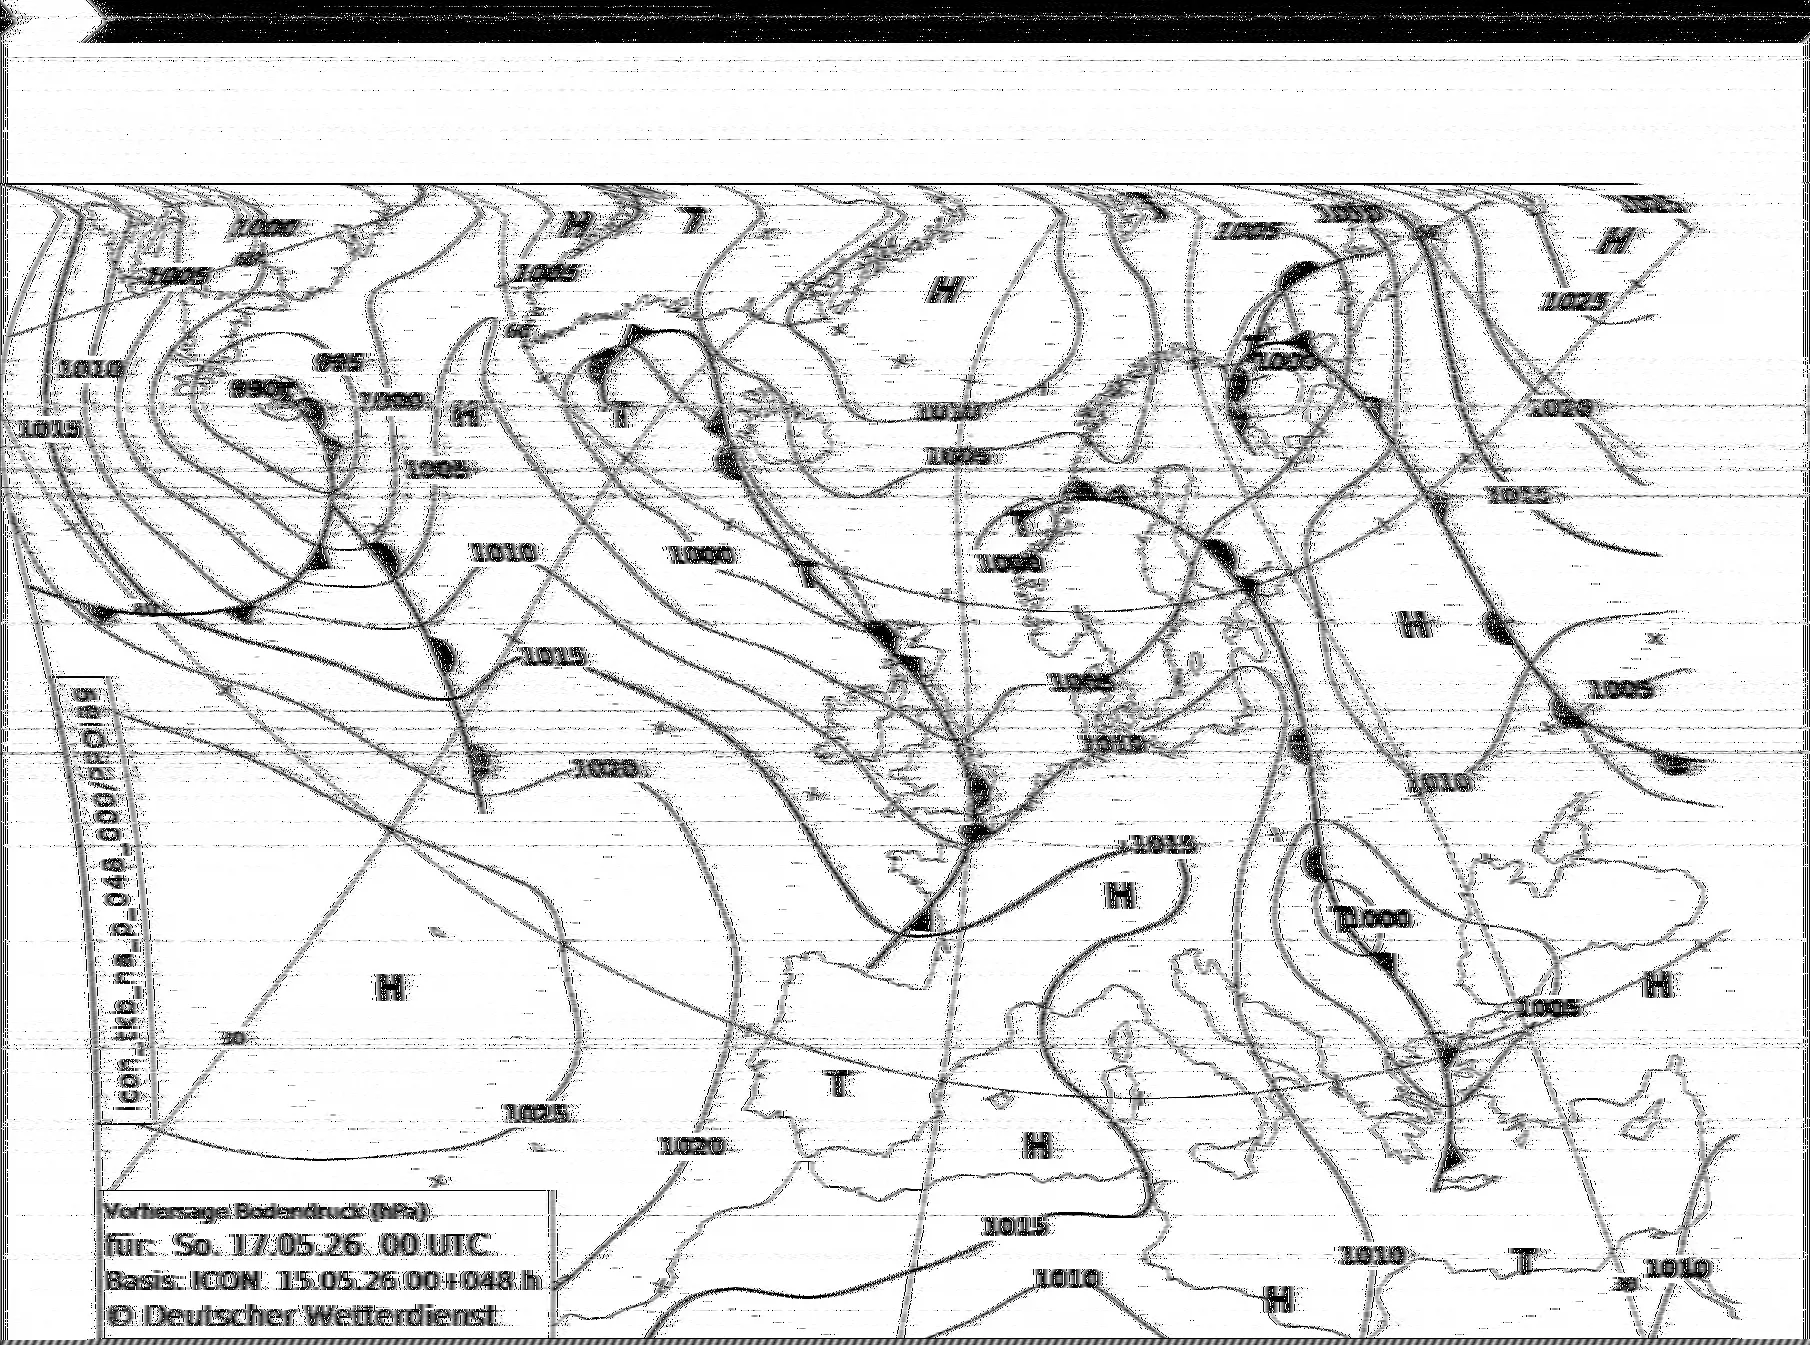
This first decoded fax still shows the post-alignment tail sliced into ~20 image rows of black with a left-edge pulse – the visible noise band. This was subsequently corrected to display only the trailing fractional-line residue (<0.5 s of samples).
Interestingly, the first weather fax ever decoded by Ilma has an S-shaped distortion of the inner border of the chart, while the outer border is perfectly square. The channel FIR bandpass at the front of the pipeline produces the ringing. The S-shape distortion induced by network audio jitter through a WAN path remained a stubborn case for Ilma's skew/drift correction.
In the North Sea area, weather fax charts are transmitted by Deutscher Wetterdienst (DWD) from Pinneberg on 3855, 7880, and 13882.5 kHz. 36-hour-prediction charts are broadcast at 0512 and 1256 UTC, for example.3 Met Office charts are sent by the Royal Navy from Northwood, UK.4 During development of Ilma, I used Twente WebSDR5 routed through BlackHole to receive these signals on the Mac and tweak the decoder to auto-detect the start tone.
There are weather fax stations worldwide,6 e.g. in Australia, Canada, Chile, China, Germany, Greece, Japan, Korea, Russia, Thailand, the UK, and the USA. Because these fax charts are broadcast via shortwave radio, they propagate over thousands of miles. These signals reflect off the ionosphere (skywave propagation). The lower frequencies propagate best at night, the higher ones during the day, depending on which ionospheric layer is doing the work.
A visit to Leonhard Euler
Programming the basic fax decoder revealed my struggle to recall what I should have learned in math classes. Leonhard Euler was Swiss, too, but that didn’t help me grasp his formula at a glance. It’s worth understanding his almost-300-year-old formula, and the reason becomes apparent the moment you open an SDR datasheet. The incoming signal is delivered as a complex number with a real and an imaginary part.
For a mathematical agnostic like me, numbers are all somewhat imaginary. But the term goes back to René Descartes’ 1637 work La Géométrie, where he described square roots of negative numbers as “imaginaires”. The work appeared in the Dutch Golden Age. Descartes had been drawn there by the country’s intellectual and religious freedom. It’s only fitting that the test transmissions for my decoder were received via the Twente WebSDR5 located in the Netherlands.
A century later, Leonhard Euler published e(iθ) = cos(θ) + i·sin(θ) in Introductio in analysin infinitorum (1748), joining exponential growth (analysis) and circular motion (trigonometry) and thereby laying the foundation for digital signal processing.7
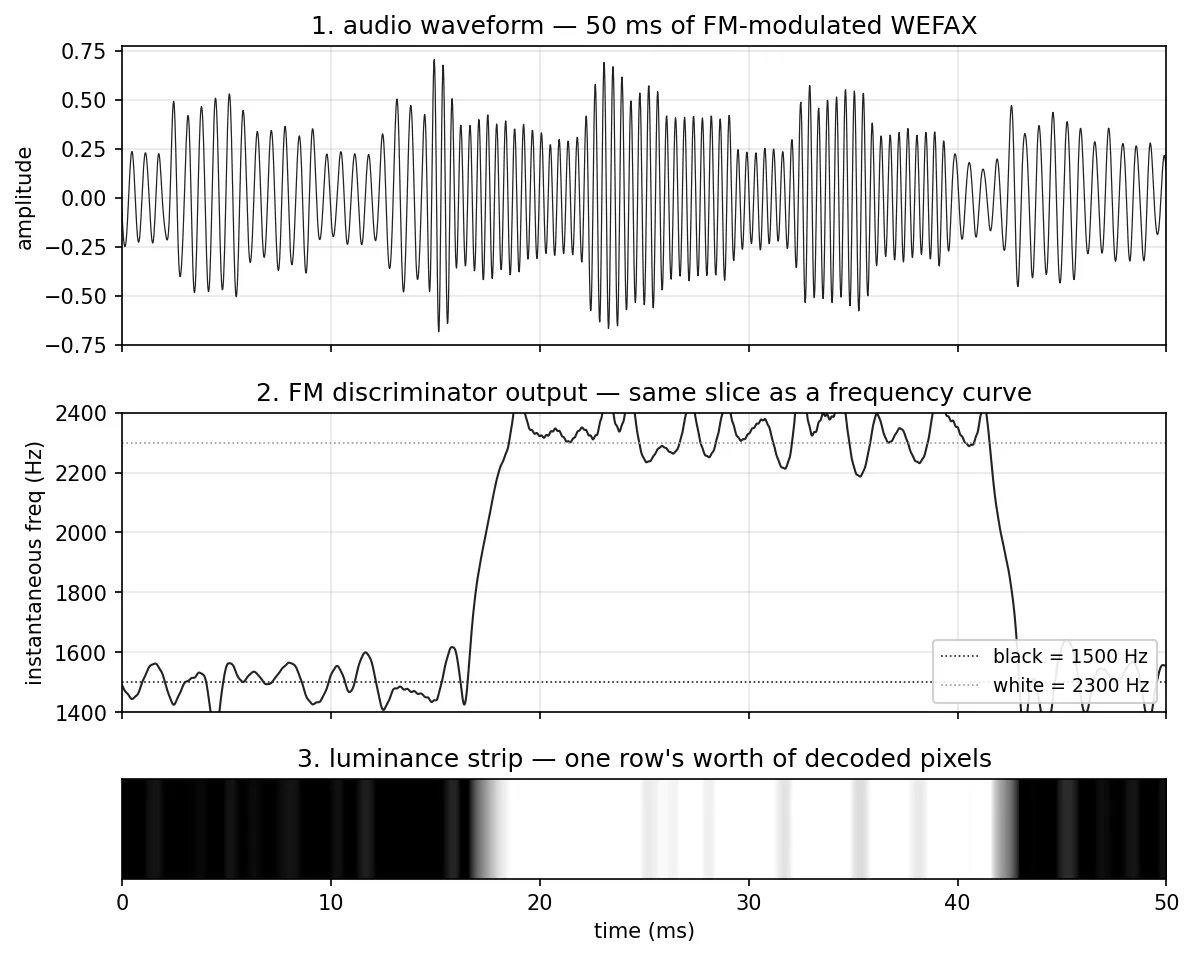
To implement a frequency-modulation (FM) discriminator, we need to compute instantaneous frequency from the analytic signal. Instantaneous frequency is the time derivative of phase. For a discrete complex signal z[n]:
f[n] = (sample_rate / (2π)) · angle(z[n] · conj(z[n−1]))
The crucial point is that SDRs deliver each sample as an I/Q pair8 – called I/Q for In-Phase / Quadrature. The I component is in phase with the carrier; it’s the complex number’s real part, i.e. Euler’s cos(θ). The Q (Quadrature denotes its 90° shift from the I component) maps to Euler’s i·sin(θ), the imaginary part of the complex number. These two numbers, taken together, encode both amplitude and phase. The principle, which also applies to the demodulation of WLAN, LTE, and 5G signals, lets us use simple algebra instead of trigonometry for signal processing.
The I/Q signal delivered by the SDR dongle, a complex 1024 kS/s stream, is decimated to 48 kHz and passes through the discriminator, which outputs instantaneous frequency in Hz. This real value is the instantaneous frequency scaled to 1500–2300 Hz; values outside the band are clipped. It’s the grey level we can map to pixels (Figure 2).
A 17th-century mathematical curiosity, perceived as imaginary, became radio infrastructure centuries later and now decodes weather charts from Pinneberg.
The photo of an exploding Zeppelin
In contrast to Ilma’s Navtex and RTTY decoding, fax transmissions do not encode the image in character bits. Instead, the luminance of an image is transmitted as a grey scale value mapped to the 850 Hz frequency band between 1475 Hz (black) and 2325 Hz (white).9 Weather fax still uses USB, but needs a considerably higher bandwidth than Navtex or RTTY.
Press photo agencies had been using this technique since the 1920s, until digital transmission emerged in the 1990s. Think of the exploding Hindenburg Zeppelin in 193710 or the flag raising on Iwo Jima in 1945: iconic photos scanned on a drum and transmitted by fax.
Technical standards define the specifications for weather fax transmissions.11 A weather fax transmission is marked by a 5-second start tone (300 Hz is used for the IOC 576 standard; 675 Hz is for IOC 288). A narrowband Goertzel on the luminance gates the decoder on. The detector is cheap even in Python because SciPy’s compiled lfilter runs the two-pole IIR inner loop, so Python only pays its overhead once per 10 ms block, not once per sample. Then follows a 30-second phasing band with alternating black/white pulses at line rate (120 lines per minute with about 1810 pixels/line). This is used to correlate the luminance stream against an ideal phasing template to find the column-zero offset within a line. This is horizontal alignment – get it wrong and the image wraps. Pick the wrong line-aspect ratio and the chart stretches. At the end of the transmission, a stop tone (450 Hz) is detected by the same Goertzel pattern; this ends the page.
With the weather fax protocol understood, the real obstacle becomes the clocks.
Give me your clock, or: Straight No Chaser
The most difficult part of fax decoding is to get the skew/drift correction right (Figure 3). Two clocks have to agree: the transmitter’s drum (or its modern equivalent: the line-clock generator at Pinneberg) and your receiver’s audio sample clock. They never do, not even in Switzerland.
Let’s not enter Bergson’s durée12 but use Einstein’s time and state the problem in numbers: a weather fax is transmitted at a speed of 120 lines per minute, so one line takes 500 ms. One line has ~1810 pixels (π·576, according to IOC);11 at 48 kS/s after the discriminator, that’s ~13.3 audio samples per pixel, or 24000 audio samples per line. A typical SDR-Pi or SDR-Mac combo might have a deviation of ±50 ppm; that’s a 30 ms cumulative offset for a 10-minute chart. The result is ~110 pixels of accumulated drift. That’s the skew that turns a chart into a parallelogram if you don’t correct it. Anything time-varying on top (thermal, Doppler, network jitter, AGC interactions) adds more drift.
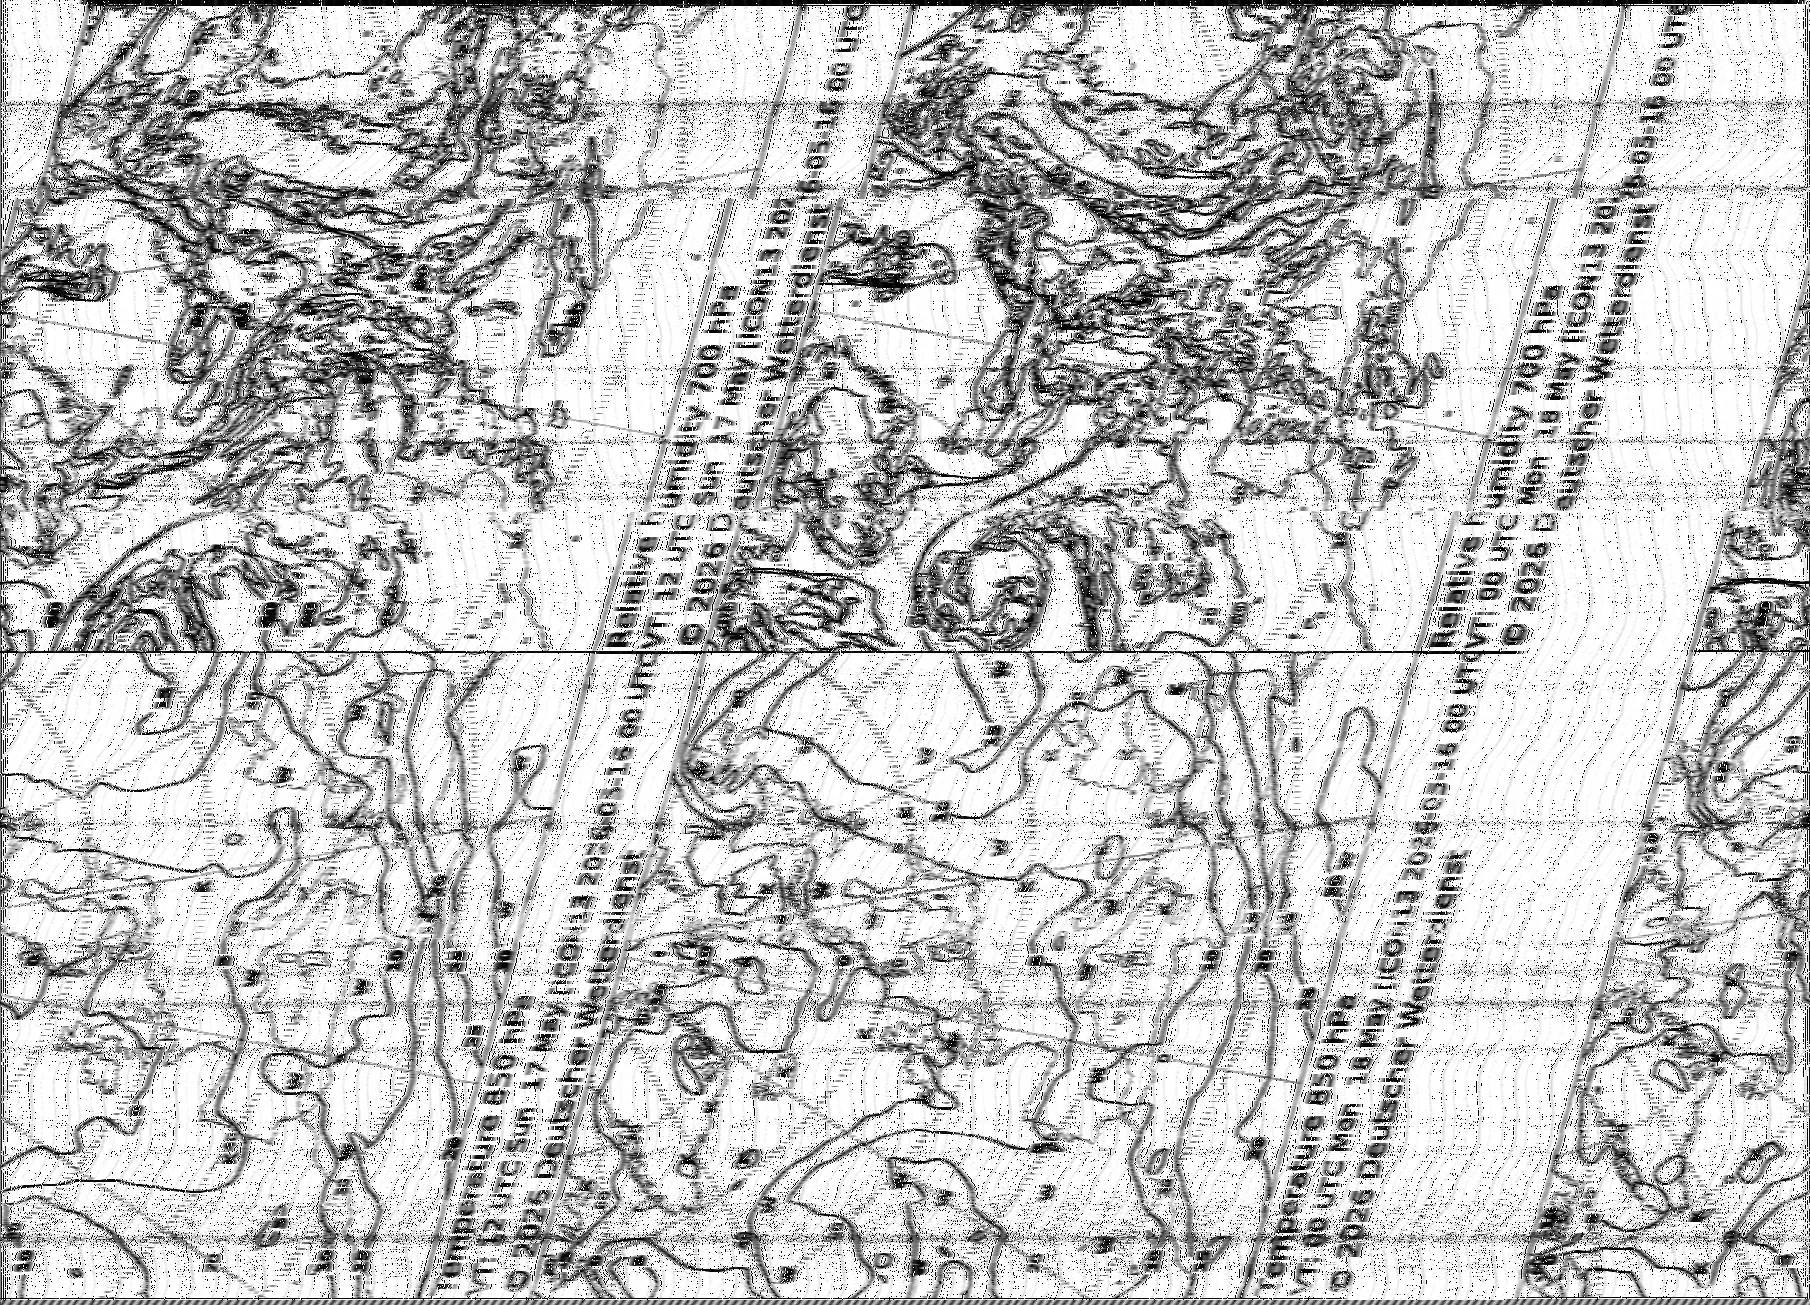
To solve the skew/drift problem, Ilma implements several approaches.
- Replace the nominal samples-per-line with a per-page measurement, accurate to ≈4 ppm at 24k samples/line, and use autocorrelation of the phasing-band luminance, with parabolic peak interpolation. The phasing band gives ~60 pulses over 30 s – plenty of repetitions to pin the period.
- Closed-loop drift tracking during receive corrects per-line phase drift caused by residual clock error left over after #1, and follows slow drift by leading-edge tracking on a normalised gradient. Most weather fax images have a thin black-and-white “phasing strip” along the edge of each line (the same template used for the column-zero correlation). Ilma can track the leading edge of that strip per line and feed corrections into a PI controller.
- Sample-clock calibration using a one-shot self-calibration utility from a .wav (assuming the broadcaster is transmitting at exactly 120 LPM) and an optional long-term passive estimator. To hedge against within-page clock walk, continuous recalibration against the (NTP-disciplined) system clock is applied using a sidecar file for every .wav recording.
These strategies complement each other. The last point is significant if the signal goes through an SDR-RTL ➞ SDR++ ➞ BlackHole chain. If the signal is read directly from the SDR dongle, with the RTL-SDR V4 crystal as the time base, intra-page drift is negligible and the disciplinator’s correction has near-zero impact.
Always have a plan
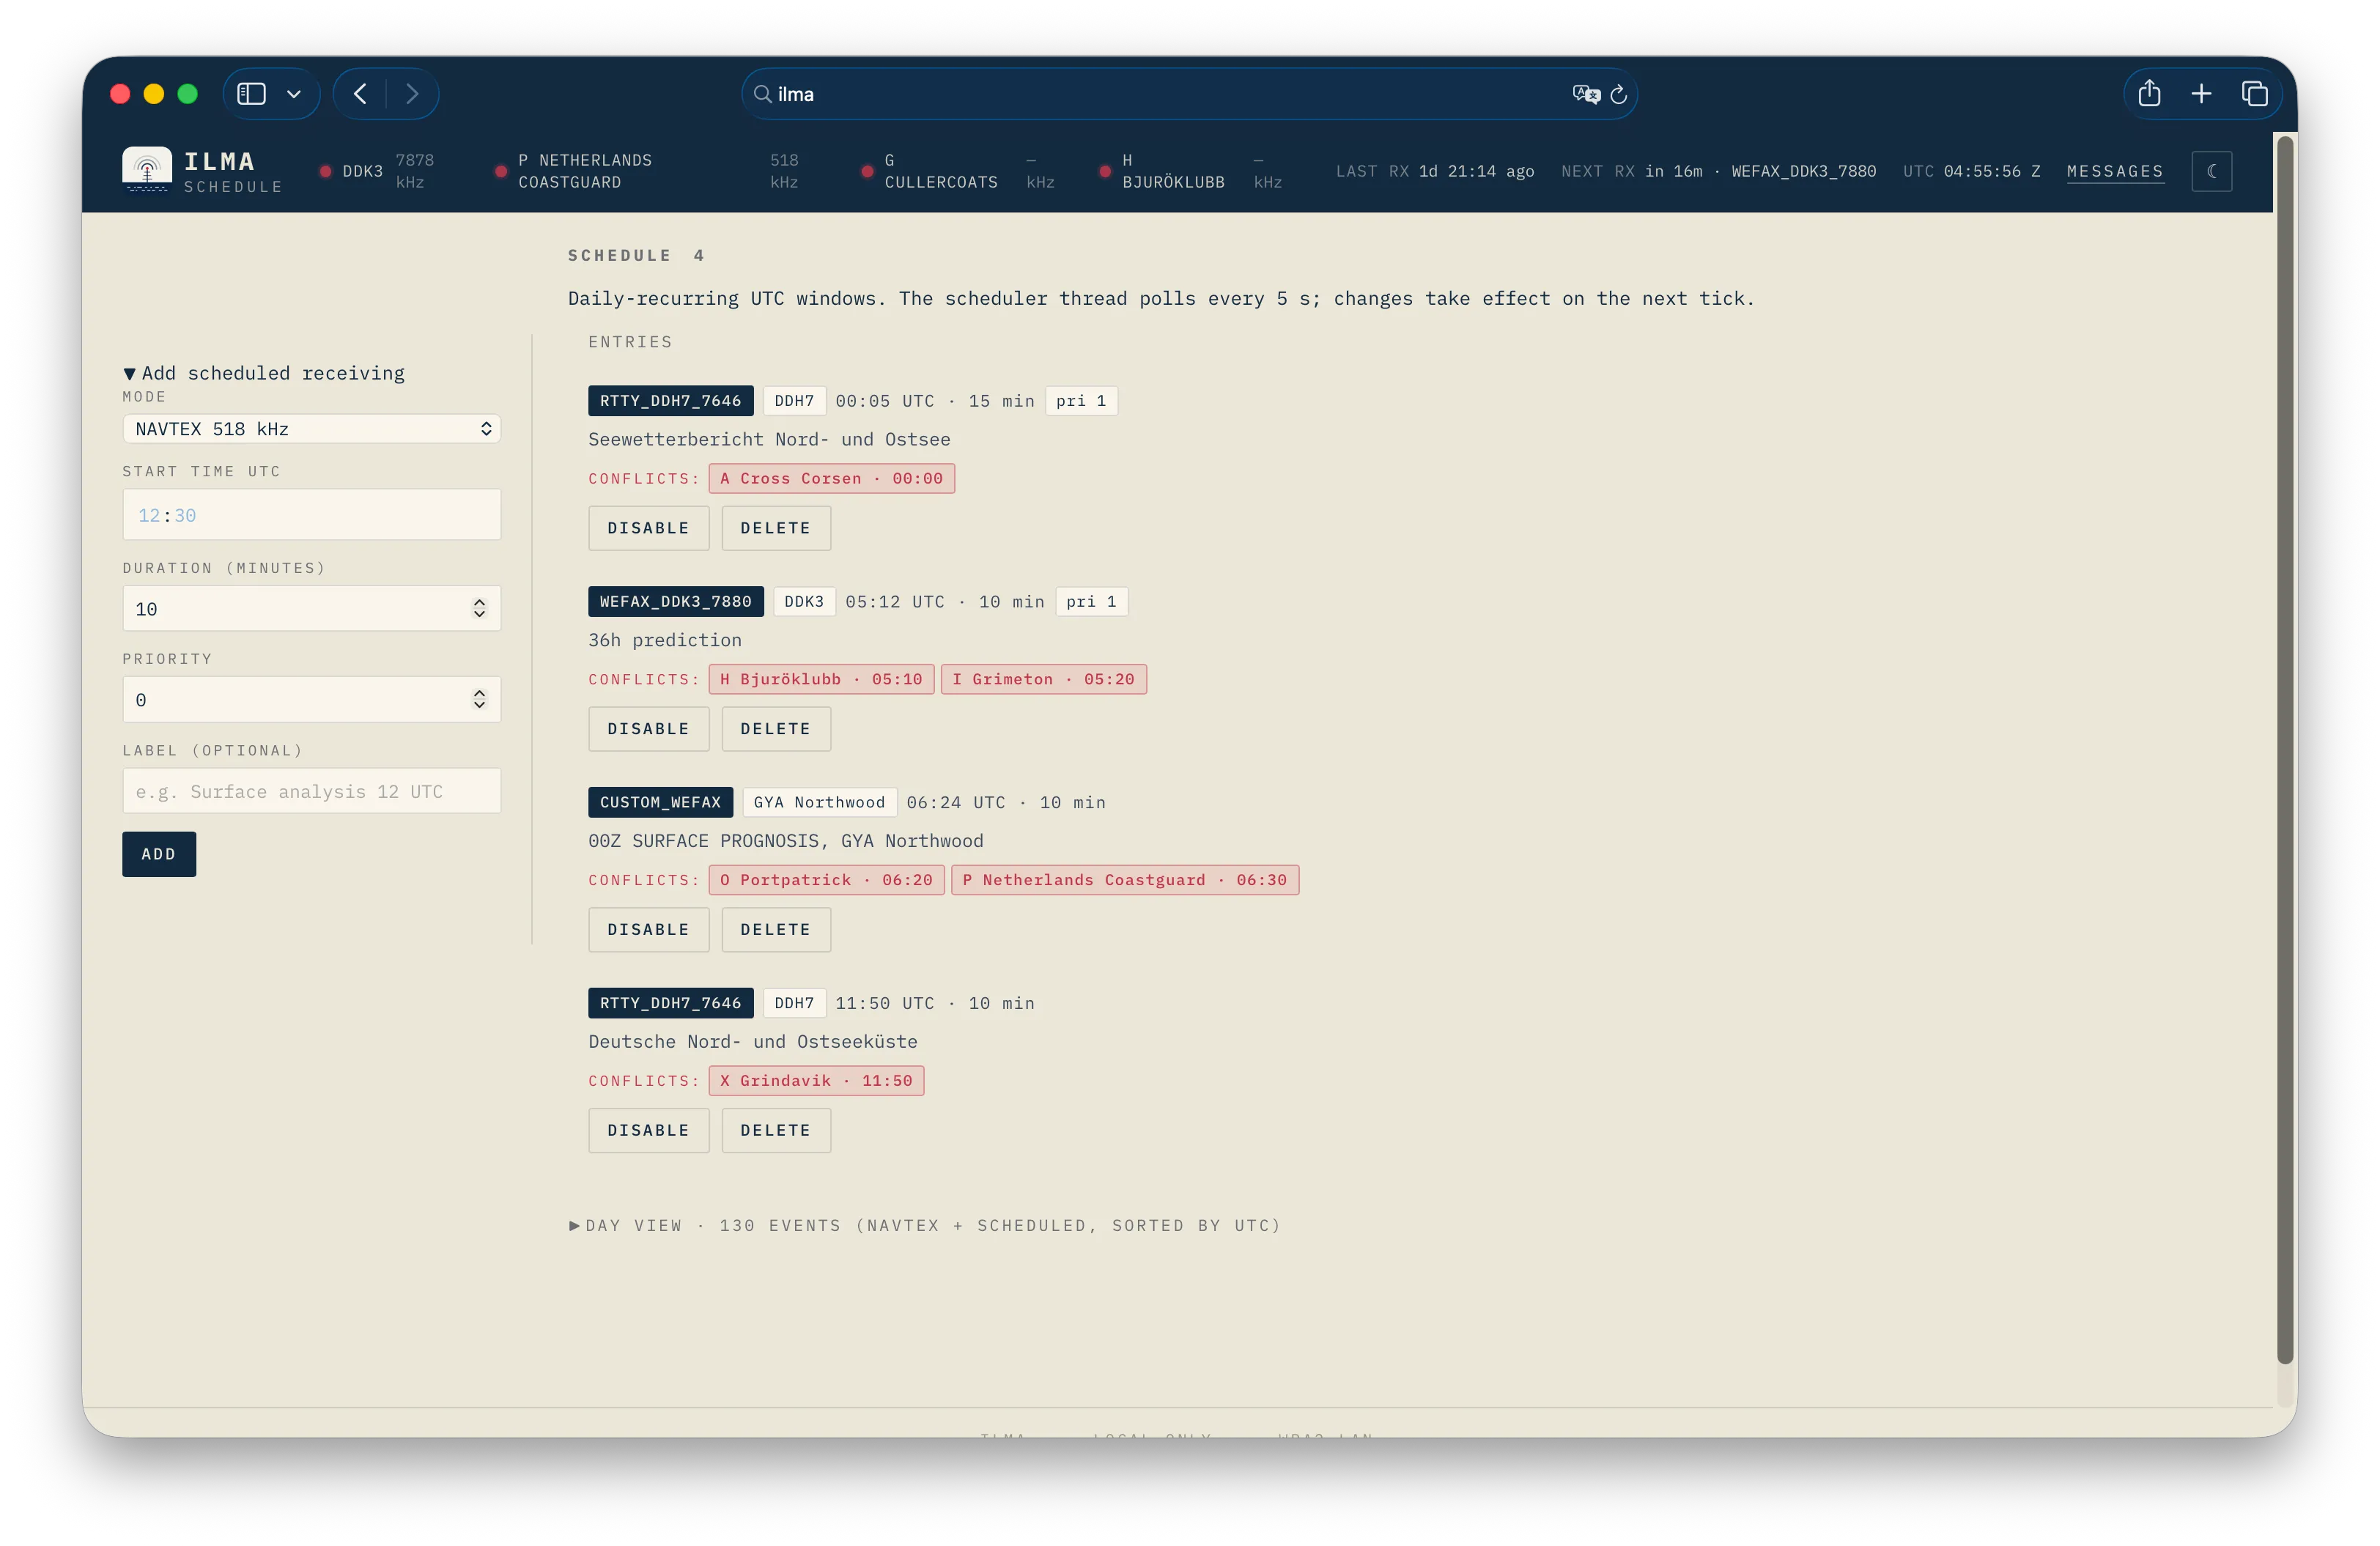
Ilma is primarily a Navtex decoder running headlessly on a Raspberry Pi. A scheduler page on the web UI (Figure 4) lets you add specific times and frequencies for weather fax or RTTY reception slots. These are stored chronologically in the same database as the decoded Navtex messages. Ilma’s additional decoding modes (weather fax, RTTY) add redundancy to the weather bulletins received via Navtex.
For example, you’re continuously receiving Navtex messages, but in addition you might want to get the daily DWD weather prediction chart sent from Pinneberg at 0512 UTC on 7880 kHz. Ilma lets you schedule a slot for that. At the specified time, Ilma temporarily switches from Navtex reception to the given frequency, and the weather fax image is decoded and stored to view later. The same flow applies to a 5-day forecast for the Baltic sent via RTTY on 7646 kHz at 0330 UTC (DWD’s DDH7 station).
Ilma finally getting it right
Tests on the Pi revealed yet another problem. The decimator could not keep up with the I/Q readouts of the arriving weather fax signal. The arriving charts had only a third of the original height. Librtlsdr’s USB ring buffer filled up faster than it could be drained. The samples silently dropped at the dongle level and only a third survived.
When I/Q was applied to Ilma’s continuous Navtex recording, SITOR-B’s FEC protection absorbed the dropouts in Navtex messages gracefully – they were tolerated much better. WEFAX – and RTTY all the more – are unforgiving; every dropped sample results in damage. The SDR rate was lowered from 1024 to 256 kS/s to ease the FIR running at input rate. Rolling retention of the I/Q files sidestepped disk capacity issues (using an external SSD rather than the Pi’s SD card to prevent SD card wear).13
While Ilma worked fine on the MacBook Pro M1 after that, the Pi experienced data corruption because the synchronous I/Q read could not keep up. This became apparent on the RTTY arm of Ilma. RTTY does not have inherent error correction. The I/Q recording code was rewritten applying asynchronous reading. Thereafter, I/Q was cleanly recorded – but the intended live decode couldn’t keep up in real time on the Raspberry Pi Zero 2 W.
The consequence is the RTL-SDR V4 asynchronously read at 256 kS/s via librtlsdr and directly stored on SSD for the WEFAX mode. The subsequent workflow is offline. The complex number signal is first decimated to real audio (48 kHz) and then decoded offline in chunks (for memory reasons: the Pi Zero 2 W has only 512 MB RAM).
Finally, Ilma running on the Pi received and decoded the UK Meteorological Office’s radiofax “06Z 10m WIND (48HR)” on 11086.5 kHz (GYA). Vertical lines are straight – as they are supposed to be.
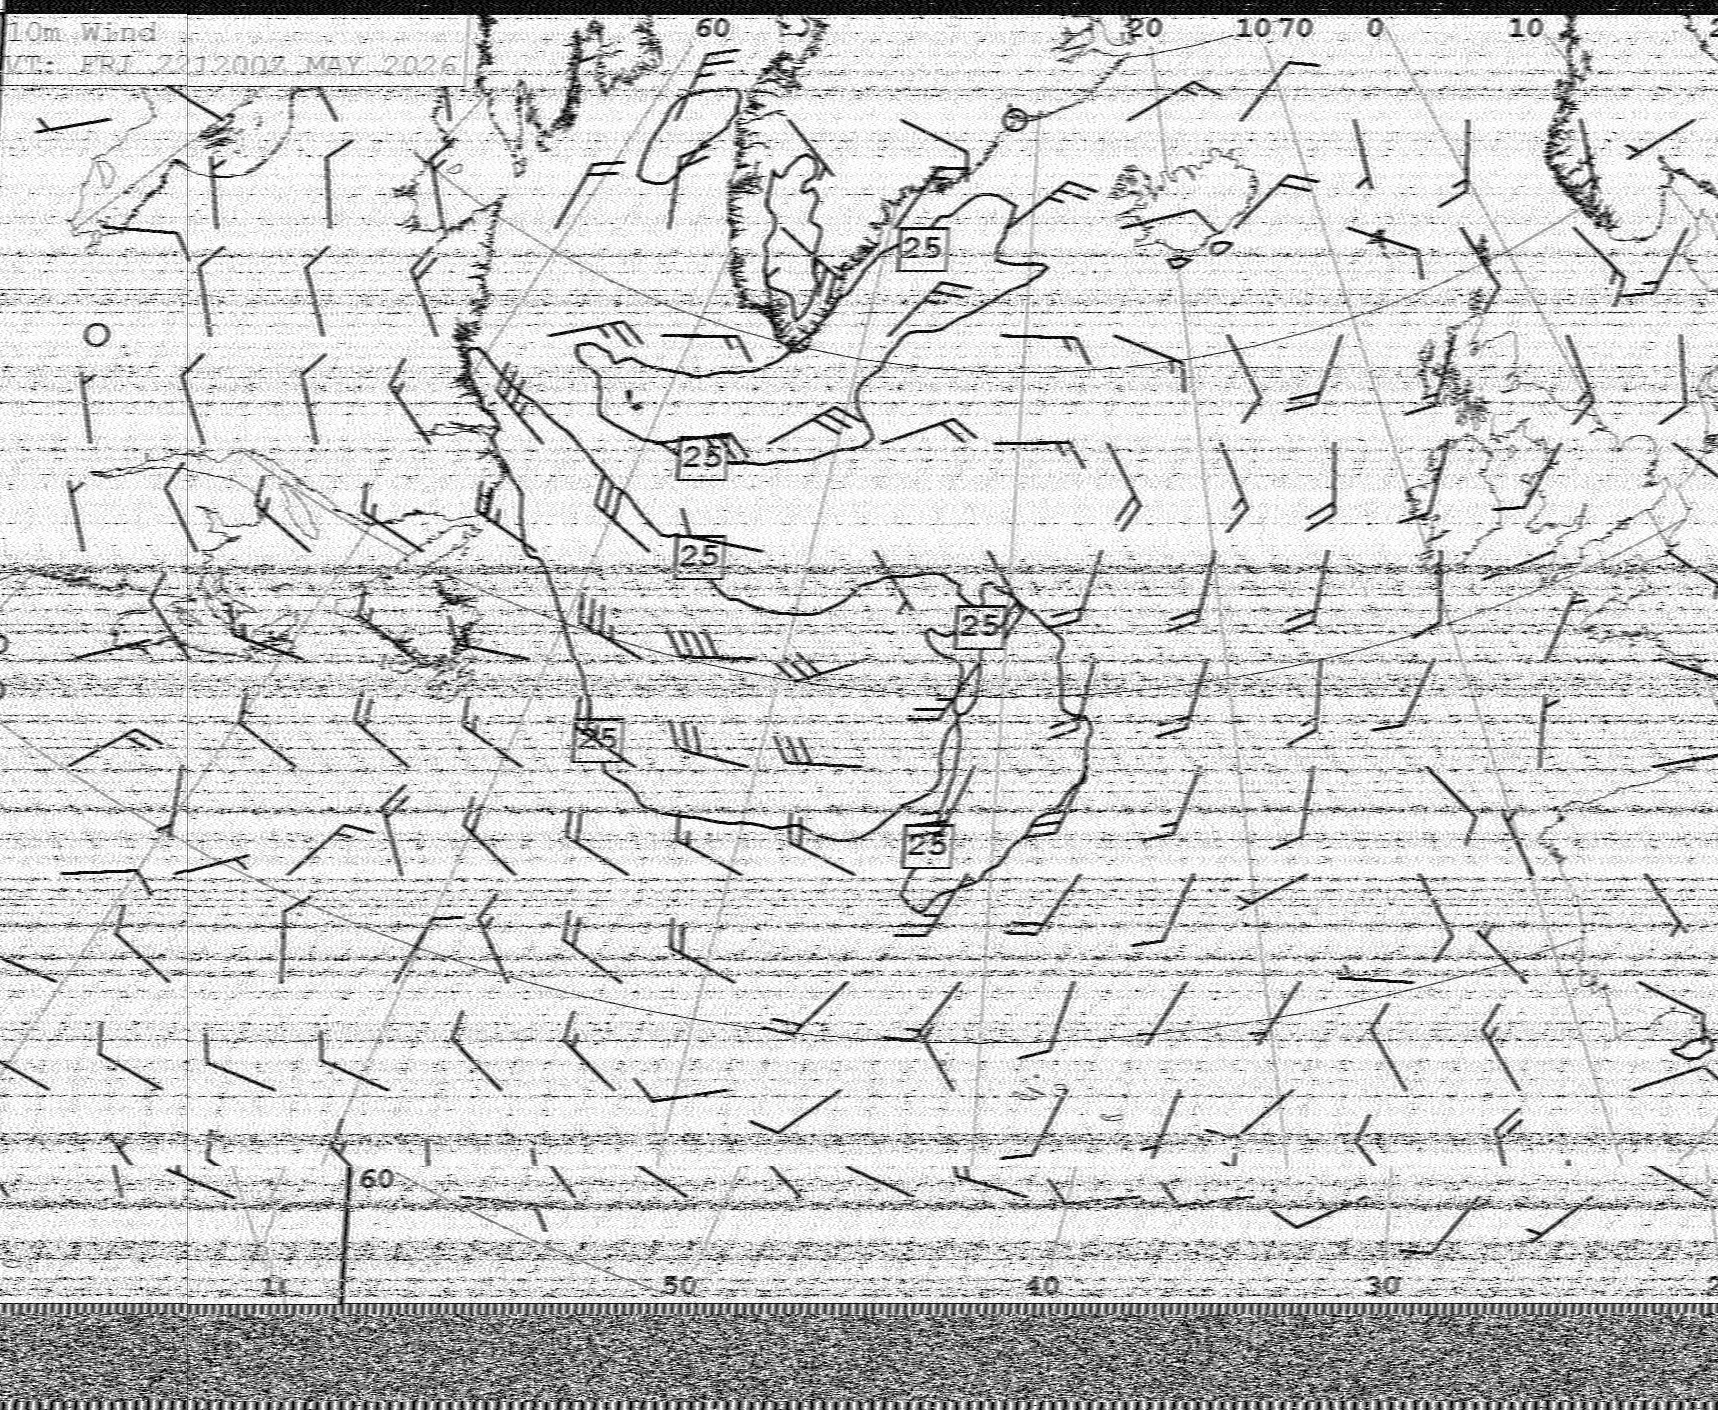
The WAN-jitter S-curve from the opening figure never came back either. It was an artifact of the WebSDR/BlackHole chain, not of the transmission itself. Recording the I/Q stream directly from the dongle removed the elastic buffering that had produced it.
Practical notes
The NASA Marine H-Vector antenna can indeed be biasTee-powered by an RTL-SDR V4 providing 4.5 V. No separate biasTee needed. This antenna is designed for Navtex (490 and 518 kHz) but it does a lot more. For example, I received WEFAX from Northwood (UK) in Switzerland on 11086.5 kHz.Lower frequencies in the high frequency (HF) band, such as 3855 kHz (DDH3) work at night but are useless by day under D-layer absorption. 7880 kHz (DDK3), the transition band, has medium range by day, while 13882.5 kHz (DDK6) has a longer range in sunlight.
While I was testing Ilma running on the Raspberry Pi to get the skewing right, the decoded charts on the Pi would sometimes be empty – despite following DWD's transmission schedule. The explanation: some transmission slots are simply void; ice charts, for example, are not broadcast in the summer months.
A ferrite placed around the power-feeding USB cable of the Pi improved the peak-to-noise-floor ratio (PND) of the antenna signal by 5-6 dB. The OLED does not cause significant radio frequency interference (RFI) to the Pi's radio reception.
Footnotes
-
Ilma is Proto-Uralic for air. In the Finnish Kalevala, songs propagate through the air to act at a distance. For more technical details of Ilma, see Ilma, a Navtex Decoder for the Raspberry Pi. ↩
-
What can produce an S-curve on a rigid grid? 1) Network audio jitter through a WAN path. Producer-consumer rate mismatch builds up, then drains in a burst, then rebuilds. WebSDR through a browser’s audio buffer, then through BlackHole, has multiple stages of elastic buffering and the buffer-level oscillation on long-haul paths typically lasts minutes, comfortably matching one S-cycle over a 10-minute chart. 2) HF ionospheric group-delay oscillation. Real but small. Skywave path length on 7.88 MHz can vary by a few hundred µs over minutes (D-layer breathing, multipath fading); at 48 kHz that’s tens of samples or a few pixels. Could account for a subtle wobble but probably not the amount of visible S-shape distortion. 3) OS audio resampler. macOS CoreAudio sometimes inserts a SRC stage between BlackHole and the consumer if the rates don’t match exactly. SRC implementations can have low-frequency residual phase error. Less likely if both sides are nominally 48 kHz. 4) Receiver LO thermal drift. Affects FM detection (column position shifts via DC offset of the discriminator), but the effect is monotonic as the dongle warms up – this would cause a one-way drift, not an S-shape. ↩
-
The transmission schedule of GYA Northwood, UK. ↩
-
WebSDR was developed by Pieter-Tjerk de Boer, who also operates the Twente WebSDR used here for testing Ilma’s decoder. ↩ ↩2
-
In 1831 (Theoria residuorum biquadraticorum), Gauss systematized the complex plane and proposed the term “lateral numbers” instead of “imaginary”, but it was too late. Charles Steinmetz applied complex numbers to alternating current (AC) circuit analysis in 1893, so AC engineering became algebra instead of calculus. In the 20th century, the work of Shannon, Nyquist, and Cooley-Tukey opened the way for digital signal processing.
Nyquist H. Certain Topics in Telegraph Transmission Theory. AIEE Trans 1928;47:617–644. This is the paper that established the sampling theorem later named the Nyquist rate.
Shannon CE. A Mathematical Theory of Communication. Bell System Technical Journal 1948;27:379–423 and 623-656. The three pillars of this paper are 1) the separation of signal from meaning (philosophical foundation), 2) a source with entropy H bits/symbol can be compressed to H bits/symbol on average but no further (the compression limit), and 3) even in the presence of noise, it is always possible to transmit signals reliably up to the channel capacity, not beyond (the noisy-channel coding theorem, i.e. the transmission limit).
Cooley JW, Tukey JW. An Algorithm for the Machine Calculation of Complex Fourier Series. Mathematics of Computation 1965;19:297–301. This is the paper that brought the FFT into general use and made real-time digital signal processing possible. Gauss had the idea in 1805 but it went unpublished and was forgotten. ↩ -
Either an SDR has two analog-to-digital converters (ADC) sitting 90° apart, or the I/Q separation is done digitally. My relatively cheap RTL-SDR V4 is a low-IF receiver: the R828D tuner downconverts to a low intermediate frequency, a single ADC in the RTL2832U samples it, and the I/Q separation is done digitally inside the chip. ↩
-
NOAA specifies 1500 Hz as black and 2300 Hz as white – ±400 Hz around the 1900 Hz carrier. ↩
-
Yes, that’s the one on the cover of Led Zeppelin I (1969). ↩
-
IOC 576 (Index of Cooperation) is the primary technical parameter used for receiving analog Radiofax (WEFAX) weather charts over shortwave radio. ITU-R Recommendation M.1677-1 specifies the technical characteristics of analogue-modulated facsimile transmissions in the maritime mobile service. WMO No. 9 Vol D is published by the World Meteorological Organization. This reference manual provides the operational schedules and exact radio frequencies for maritime radio-facsimile stations globally. ↩ ↩2
-
Bergson H. Essai sur les données immédiates de la conscience. Paris, 1889. ↩
-
Consumer SD cards are typically rated 1-3 TB TBW (total bytes written). ↩